[ad_1]
Market Overview: Nifty 50 Futures
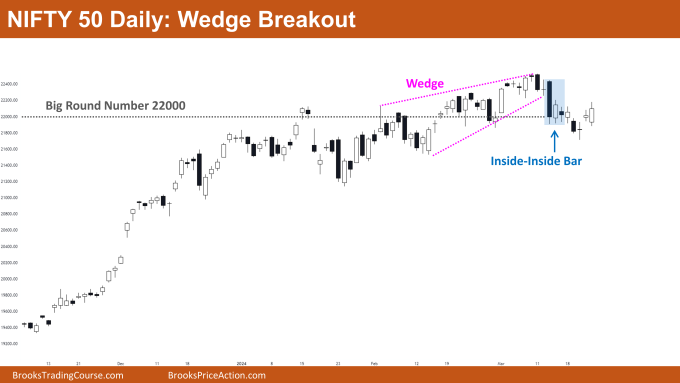
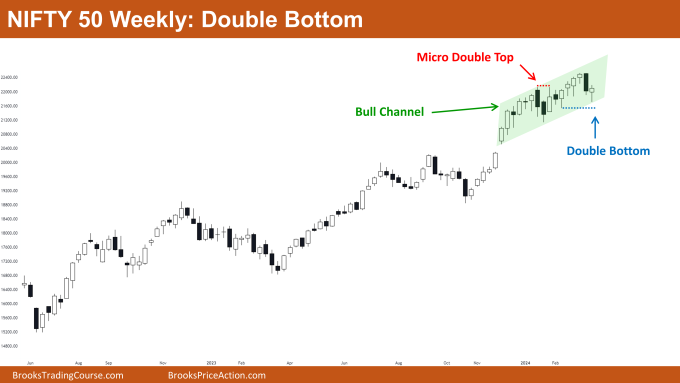
Nifty 50 Double Bottom on the weekly chart. This week witnessed intriguing developments in the market. A bull bar with a small body and a bottom tail formed, signaling a weak follow-through attempt by the bears aiming for a reversal. Additionally, a double bottom pattern emerged, indicative of potential bullish momentum, especially considering the ongoing bull trend. Despite a bear breakout of the Wedge Top on the Nifty 50 daily chart, the lack of significant follow-through by the bears suggests continued trading range price action around the significant level of 22000.
Nifty 50 futures
The Weekly Nifty 50 chart
- General Discussion
- Bears have again failed to cause a reversal. After consecutive small bull bars, the bears attempted a reversal and managed to form a strong bear bar, but they couldn’t sustain good follow-through bars.
- Bulls currently holding long positions should maintain their positions until the bears manage a strong reversal attempt.
- It’s advisable for bears to avoid selling since the market is still in a robust bull trend, currently trading near the bottom of the bull channel.
- Deeper into Price Action
- Over the last 10 weeks, bulls have struggled to form significant, strong bull bars, resulting in an expanded trading range in price action.
- Bears are still unable to produce strong consecutive bear bars, diminishing the likelihood of an immediate reversal.
- If bulls can generate another consecutive bull bar on the weekly chart, the likelihood of a bull breakout from the double bottom pattern will significantly increase.
- Patterns
- The Nifty 50 has formed a double bottom pattern on the weekly chart. If bears manage to close strongly below the neckline of the pattern, the chances of a trading range equivalent to the height of the bull channel will rise.
The Daily Nifty 50 chart

- General Discussion
- The market on the daily chart has been stuck within a significant trading range for several days.
- Traders can employ a straightforward strategy: buy low, sell high. This strategy allows both buyers and sellers to profit in this market phase.
- Deeper into Price Action
- For quite some time, the market has hovered around the significant psychological level of 22000. This has led to an expansion in the range of trading prices.
- It’s essential to note that during a trading range phase, breakouts are often short-lived. For instance, observe the bearish breakout of the wedge pattern in the chart above; it was quickly followed by a reversal.
- When trading breakouts within trading ranges, it’s crucial to act swiftly to lock in profits or minimize losses. Reversals happen frequently during this phase.
- Patterns
- As the market is situated close to the major psychological level of 22000, traders should anticipate trading range price action until a substantial breakout occurs.
- Patterns such as inside bars, inside-inside bars, and inside-outside-inside bars are prevalent during trading range phases. Therefore, if you enter trades based on these patterns while the market is in a trading range phase, it’s advisable to exit quickly and avoid holding positions for extended swings.
Market analysis reports archive
You can access all weekend reports on the Market Analysis page.
[ad_2]
Source link
